|
Social Security
Trust Fund Projections (2000-2010 Reports) under alternative assumptions |

|
In the Spring of each year, the Social Security Trustees issue an "Annual Report of the Board of Trustees of the Federal Old-Age and Survivors Insurance and Federal Disability Insurance Trust Funds."
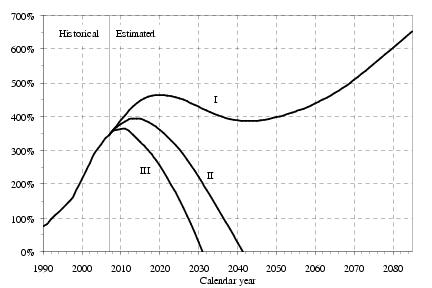
Each of these reports includes a table and a chart illustrating the recent history and long-term projections of the Trust Fund Ratio -- the Fund's assets divided by its costs -- indicating the "health" of the Fund. The figures are calculated for three different "cost" projections -- Low-Cost, Intermediate-Cost, and High-Cost. (See below for more details.) Few people are aware of these different scenarios, because the only one publicly displayed and commented upon is the Intermediate Cost projection, whose "bankruptcy" sometime around 2040 is the constantly stated reason for "fixing" Social Security.
There is a strong negative correlation between Social Security's overall finances -- the Trust Fund's income and its net increase (see the graphic presentation of this correlation). This is reflected in the fact that the three scenarios portrayed in the long-term projections correspond to (approximately) three levels of the unemployment rate:
| I | Low-cost | 4.5% |
| II | Intermediate-cost | 5.5% |
| III | High-cost | 6.5% |
The fact that the Low-Cost projection never goes bankrupt, and, in fact, increases -- dramatically in the more recent projections -- raises the obvious question of whether Social Security might ultimately best be "saved" by keeping a low level of unemployment in the economy, or, if the government fails to carry out its responsibility in that way, to provide the Social Security Trust Fund with "unemployment insurance," rather than crippling or destroying it through privatization or onerous cost/benefit changes.
The table below shows the charts for these projections from each of the Trust Fund reports for the years 2000 through 2010. The same charts were available in earlier reports, but reports earlier than 2001 seem to have disappeared from the web. Each chart is shown with links to its data table, to the report's homepage, and to the chart's location in the report; clicking on a chart will display it in full size. A plain text version of the data from the 2010 report, suitable for importation into a spreadsheet, is available here.
 Data 2010 Chart |
 Data 2009 Chart |
 Data 2008 Chart |
 Data 2007 Chart |
 Data 2006 Chart |
 Data 2005 Chart |
 Data 2004 Chart |
 Data 2003 Chart |
 Data 2002 Chart |
 Data 2001 Chart |
 Data N/A 2000 Chart was cached |
Pre-2000 Not available |
The Three Alternative Cost Assumptions
The Trustees' Report describes the three cost assumptions this way (formatting added):
The low-cost alternative reflects a set of assumptions that improves the projected financial status of the trust funds relative to the financial status under the intermediate set of assumptions.
|
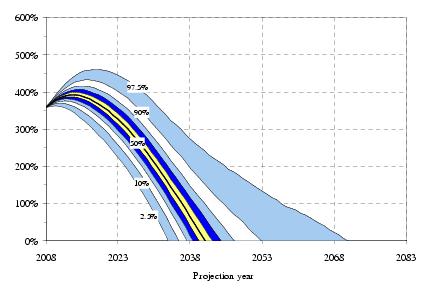
To deal with this last point of probabilities, the report offers a "stochastic projections" Appendix E, which offers a probability distribution plot of the Cost/Asset ratio (Figure VI.E1. Annual Trust Fund Ratios), indicating the probability that the ratio will lie to the left of variously-labeled probability lines. Here are examples of the plots from the last six reports (2005-2010), with the year annotations providing links to the originals, the charts themselves providing links to full-size images.
There is a clear trend here, implying a growing sense of declining financial health of the Trust Fund. The probability lines are moving to the left (earlier problems), and down (lower financial health). Note particularly the change in vertical scale from a 2008-and-earlier maximum of 600 to a post-2008 maximum of 500. This implies a belief (a.k.a. projection) that the possibility of the low unemployment economy implicit in the "Low-cost" Trust Fund Ratio plot line number "I" (above) is shrinking every year. If so, it again is worth noting that the focus in "fixing" Social Security should be on "fixing" unemployment, rather than tampering with the social contract long embodied in the Social Security system.
|
Written: November 12, 2010
Posted: November 12, 2010 Last revised: December 10, 2010 |
|