|
IEA Pocket Charts
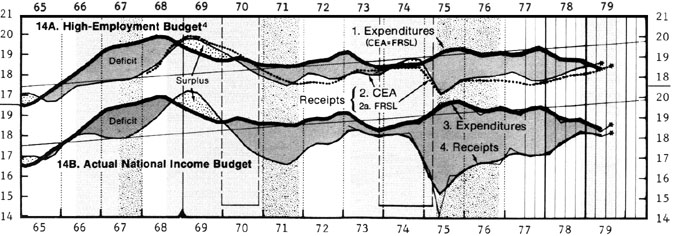
Panel 14 |

|
|
Chart-specific notes (footnotes to series names) | |
| all: | These are ratios to Capacity-GNP -- add 2.8 for approximate % of GNP during 1977-78 |
| 4. | 4% unemployment definition, adjusted to 1955 demographics (includes supplementary and special unemployment benefits) |
General notes
This is one of 20 regular and a dozen periodic chart panels taken as a sample from the final issue -- December 1979 -- of the initial series of IEA Pocket Charts. The compact and analytically advanced economic charts feature the following analytical features:
A full guide to the presentation and analytical features of the charts -- an understanding of which is necessary for making full analytical use of the charts -- is available at How to Read IEA Charts.
Printing is best done in landscape mode. For portrait mode, use a 75% size factor.| Posted: December 22, 1998 |
|