|
Social Security
Needs 'Unemployment Insurance' Introduction |

|
PDF version
Social Security's basic financial problem -- The problem is the irresponsible management of the economy -- not the Social Security system or its level of benefits. The charts below clearly demonstrate the close correlation of Social Security finances with the unemployment rate. This, combined with the Social Security Trustees' acknowledgement of permanent solvency for the system at reasonably low levels of unemployment, provides the basis for an "unemployment insurance" mechanism for the system, analogous to that for individuals, with no cuts needed.
"Budget cutting" of Social Security benefits is inappropriate. The benefits are not a tax-financed budgetary "entitlement." They are a government-sponsored, primarily self-financed, off-budget pension program -- like many employer-sponsored pension programs. Social Security's Trust Fund was built up over decades by contributions (not "taxes") from people who expect -- as with any pension program -- to receive the benefits they paid for.
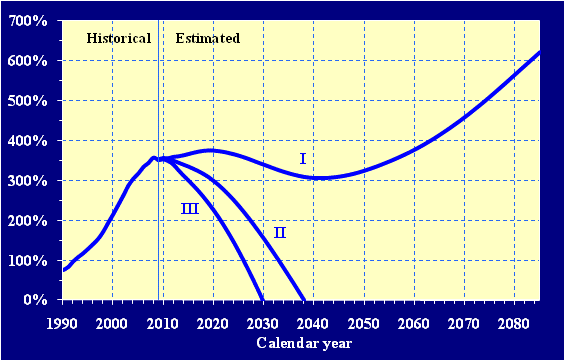
No "bankruptcy" at reasonably low unemployment -- The Social Security annual report includes a chart of three different 75-year projections of Social Security Trust Fund finances, based on different economic assumptions:In Figure 1, the "High-Cost" Projection III assumes an average 6.5% unemployment and goes bankrupt in 2029. "Intermediate" Projection II assumes 5.5% unemployment and goes bankrupt in 2037. In any case,
The notion that the nation should -- or even could -- tolerate
5.5% unemployment for 75 years is unconscionable.
But the "Low-Cost" Projection I, which assumes 4.5% unemployment, is solvent indefinitely. Yet it is ignored in virtually all public discourse -- which tends to focus on Projection II.
Unemployment and inflation -- It is often erroneously believed that low unemployment would be inherently inflationary. However, in all four post-1950 periods of 4.5%-or-less unemployment, inflation was low to moderate, and there is no credible reason why our economy, using appropriate stabilization tools, cannot be managed so as to maintain stable full employment without significant inflation.Social Security needs "Unemployment Insurance" -- This paper proposes a mechanism for giving the Trust Fund "unemployment insurance," that would, in a recession, transfer from the Treasury's general fund to the Trust Fund an amount equal to the difference between Social Security's current net income and the Trustees' 4.5% unemployment level. (The process could even involve transfers in the other direction -- to the general fund -- when unemployment is again brought down to the pre-Bush 4% level.) This document discusses the Social Security/unemployment relationship and how that relationship can be used to determine the appropriate size of such transfers.
Determining the amount of the recession "unemployment insurance" benefit -- Just as in the case of an individual worker during a recession, the aspect of the Trust Fund's finances most clearly hit by unemployment is its net income -- the Net Trust Fund Increase (NTFI). Figure 2, below, shows the unemployment rate on the horizontal axis and the NTFI on the vertical axis. Inherent in the NTFI are two factors not present in unemployment: a growth trend (of the economy) and inflation. These two factors make comparisons of NTFI values across time periods -- or with unemployment -- invalid, so they been filtered out by dividing the NFTI by a data series that contains these same factors: Potential GDP (PGDP). The NTFI values are annual data from 1984 -- the year following the major reorganization of Social Security finances by the Greenspan Commission and the Social Security Amendments of 1983 -- to 2009 (the most recent data in the Trustees' 2010 report).Because changes in policy and other factors can alter relationships between statistical series over time, Figure 2 connects the data points and labels each with the year it represents:
Presented in this way (a "date-ordered two-variable plot"), the data exhibits numerous near-straight-line periods. Observation of the NTFI's component financial series reveals six optimum periods of correlation:
Regression lines for these periods are shown in Figure 3:
To aid in analysis, the regression lines for periods of recession (defined here as increasing unemployment, plot "moving right") are shown in dashed red, those in periods of recovery (decreasing unemployment, plot "moving left") are shown in solid green. The regression values for these lines, which are shown in Table 1 (the bold letters identify the lines) --- are:
| Table 1 | |||||||||||||||||||||||||||||||||||||||||||||||||||
|---|---|---|---|---|---|---|---|---|---|---|---|---|---|---|---|---|---|---|---|---|---|---|---|---|---|---|---|---|---|---|---|---|---|---|---|---|---|---|---|---|---|---|---|---|---|---|---|---|---|---|---|
R-squared Value Color Codes
|
| ||||||||||||||||||||||||||||||||||||||||||||||||||
The kind of unemployment benefits envisioned here for Social Security would be, like the more traditional unemployment benefits, part of the economy's automatic stabilizers, which tend to increase federal deficits during periods of high unemployment and depressed economic activity, and increase surpluses in good times. They are part of the cost of the federal government's failure to maintain stable full employment. Over $250 billion is being automatically added to the deficit each year at the present level of unemployment in excess of 4.5%. Table 1 indicates that at this present level of excess unemployment, the yearly transfer to Social Security would amount to another approximately $80 billion, adding to the existing financial incentive for the federal government to end the recession.
The need for further investigation -- In all but one of the six periods of correlation the closeness of fit is striking. However, many other aspects invite further study. For instance, why are the regression lines for the 86-89 and 95-00 recovery periods, which constitute essentially a single line, so different from the 04-06 recovery period, the slope of which is instead similar to the virtually parallel 90-92 and 07-09 recession periods?
From the purely practical point of view, what factors lie beneath the periods of non-correlation, and what is the significance of 2000 as the intersection point of two radically different lines? If compensation is provided at the time the year's data is finalized, there must be a mechanism for correcting that later when/if it turns out the year is part of a not-yet apparent future trend.
The purpose of this paper is merely to raise awareness of the unemployment/Social Security relationship, suggest the logic of an "unemployment compensation" program, and point out the need for further study. Making use of the relationship to create a functional compensation program requires in-depth analysis of the economic, demographic, and policy factors underlying both the periods of correlation and the transitional periods of apparent non-correlation between them. Those who wish to pursue this line of inquiry may find useful the spreadsheet used in this study.
Conclusion -- The close inverse correlation between the unemployment rate during periods that cover 85% of the 1984-2009 period strongly suggests the appropriateness of providing Social Security with "unemployment compensation" -- both to guarantee its solvency and to fulfill the financial good-faith obligation of the federal government to the participants in that pension program, rather than penalize them for damage to the system created by the economic policies of that same government.
Dr. John Atlee has over 60 years of teaching and research experience in macroeconomics, and is the founder of the Institute for Economic Analysis. Richard Atlee is a writer and research assistant.
| Period | Unemployment | Inflation |
|---|---|---|
| 1950:Q4-1953:Q4 | 3.2% | 3.1% |
| 1955:Q1-1957:Q3 | 4.2% | 3.2% |
| 1965:Q3-1970:Q1 | 3.8% | 4.0% |
| 1998:Q2-2001:Q2 | 4.2% | 1.9% |
|
In regular use, the particular value of PGDP for the relevant year would be applied; however, here the average PGDP over each regression period is used for a ballpark figure. (back)
|
Written: December 11, 2010
Posted: February 20, 2011 Last revised: April 10, 2011 |
|